What is Course Media Analytics in Sublime LMS ™?
Media Analytics is a tool in Sublime LMS ™ which teachers can access to view different engagement reports for the students who have enrolled in a course.
Teachers can easily access course-specific video analytic reports directly from the Sublime LMS ™.
They can also view the most viewed videos and students who are most engaged to your media gallery.
Note: For each media entry, details such as the number of plays, total view time, average view time, average drop-off rate, storage, bandwidth etc. are displayed on the Summary Reports.
The Student View analytics report lists all the Students who have viewed at least one video from the Media Gallery. For each Student, the total view time, average view time and average drop off-rate are presented.
Open Media Analytics

Click the Media Analytics link in course navigation.
View video Analysis
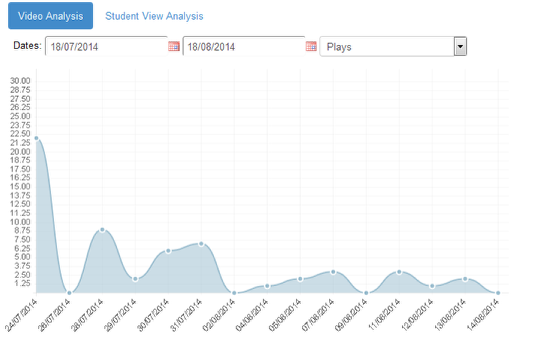
View the Video Analysis between the given dates.
Video Analysis Details
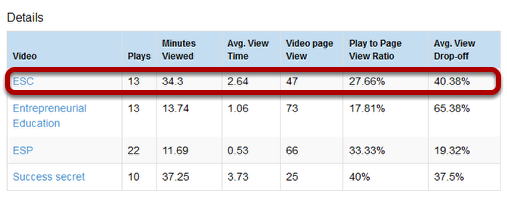
You can view the following details in Video Analysis
1. Video - Name of the video.
2. Plays - Number of times the particular video was played.
3. Minutes Viewed - Total amount of time the video was viewed in terms of minutes.
4. Avg. View Time - Average view time of the particular video.
5. Video page view Mentions how many time the video page was loaded by the users.
The above image shows, ESC video page viewed by 47 times, but the number of times it was played is only 13 times.
6. Play to Page View Ratio - Ratio between the number of times the video was played and the number of times the video page was loaded.
7. Avg. View Drop-off - Shows the average drop-off percentage when the video was played.
Note: You can view a particular video’s detailed analytics report by clicking the name of the video.
Video Analysis for particular video
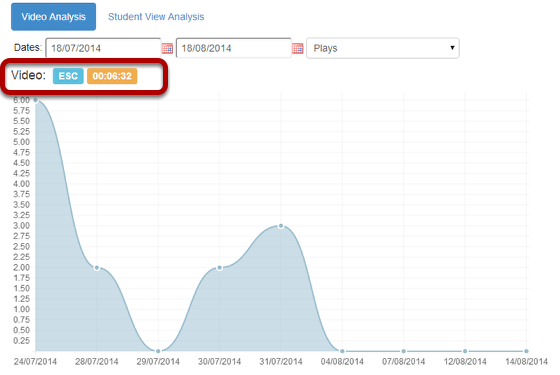
Click the name of the video.
You can view the Video Analysis for that video.
Note: You can view the name and total amount of time the video was viewed on the top left corner of the analytics.
Video Analysis to show Student View of a particular Video

You can view the following details in a particular video’s analysis
1. Student ID - Name or ID of the student who played the video.
2. User Plays - Number of times the user played the video.
3. Minutes Viewed - Total amount of time the video was viewed in terms of minutes.
4. Avg. View Time - Average view time of the particular video.
5. Avg. View Drop-off - Shows the average drop-off percentage when the video was played.
6. Video page View - Number of times the video page was loaded by the users.
The above image shows that student Mathew viewed the page 26 times, and he played the video twice.
7. Play to Page View Ratio -Ratio between the number of times the video was played and the number of times the video page was loaded.
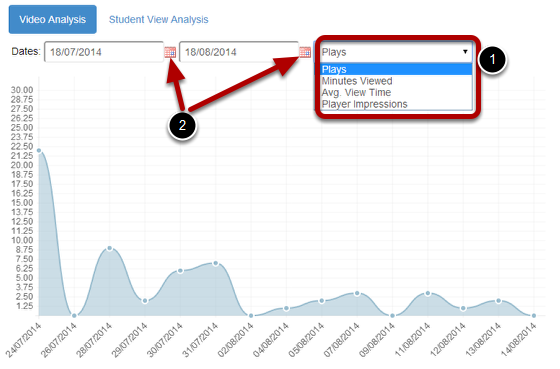
You can view the Video Analysis by Plays, Minutes Viewed, Average View Time or Player Impression.
The default view of Video Analysis is Plays.
Select the view you want to see by clicking the drop down menu shown above [1].
You can change the dates using the Calendar [2] icons.
Student View Analysis
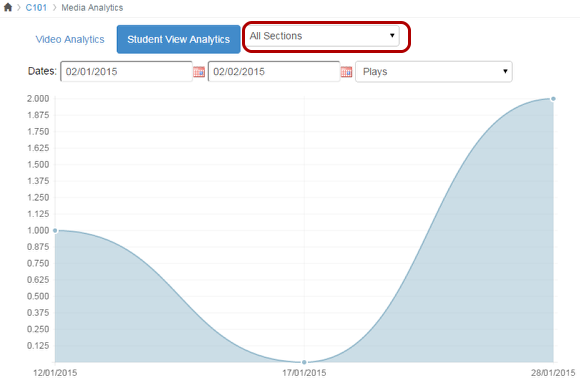
View the Student View Analysis between the given dates.
You can view the Student View Analysis in Section Basis using the Section Drop down.
Student Analytics Detail View
You can view the following details in the Student View Analysis
1. Videos - Number of videos viewed by the student.
2. User Plays - Number of times the user played the video.
3. Minutes Viewed - Total amount of time the video was viewed in terms of minutes.
4. Avg. View Time - Average view time of the videos.
5. Avg. View Drop-off - Shows the average drop-off percentage when the video was played.
6. Video page View - Number of times the video page was loaded by the users.
The above image shows that student Mathew viewed the page 68 times, and he played the video 16 times.
7. Play to Page View Ratio - Ratio between the number of times the video was played and the number of times the video page was loaded.
Note: You can view the particular Student View Analysis Report by clicking the name of the student.
Student View Analysis for a particular Student
Click the name of the student.
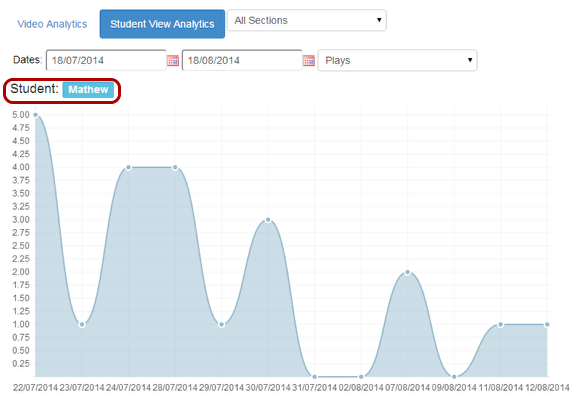
You can view the Student View analysis for the videos.
Note: You can view the name of the student on the top left corner of the analysis.
Student View Analysis Details for a particular Student
You can view the following details
-
Video - Name of the video.
-
Plays - Number of times the particular video was played.
-
Minutes Viewed - Total amount of time the video was viewed in terms of minutes.
-
Avg. View Time - Average view time of the particular video.
-
Avg. View Drop-off - Shows the average drop-off percentage when the video was played.
-
Video page View - Number of times the video page was loaded by the users.
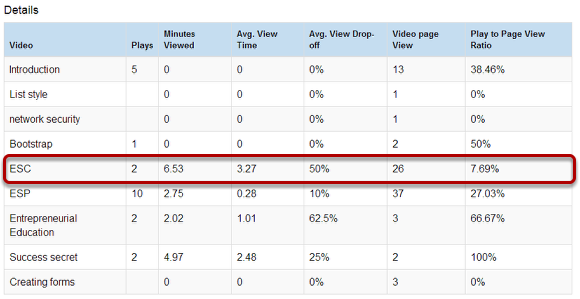
The above image shows that ESC video page was viewed 26 times and the number of times the video was played is 2 times.
7. Play to Page View Ratio - Ratio between the number of times the video was played and the number of times the video page was loaded.
